...
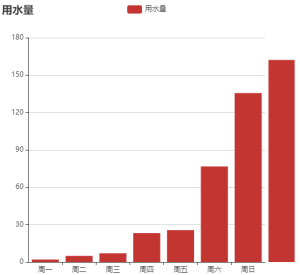
- 完整示例2--标题和图例、X轴分类:
- pkchartbar.setSeriesData("bar1", [[2.0, 4.9, 7.0, 23.2, 25.6, 76.7, 135.6, 162.2, 32.6, 20.0, 6.4, 3.3]]);
- pkchartbar.setSeriesInfo("bar1",[{name: '用水量',type:"bar"}]);
- pkchartbar.setLegendShow("bar1",1)
- pkchartbar.setTitle("bar1","用水量");
- pkchartbar.setXAxis("bar1",[{data:['周一', '周二', '周三', '周四', '周五', '周六', '周日']}]);
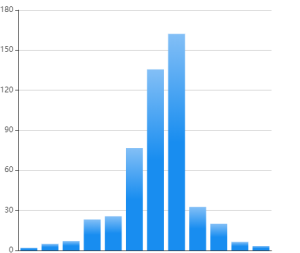
- 完整示例3--渐变效果:
- pkchartbar.setSeriesData("bar1", [[2.0, 4.9, 7.0, 23.2, 25.6, 76.7, 135.6, 162.2, 32.6, 20.0, 6.4, 3.3]]);
- pkchartbar.setSeriesInfo("bar1",[{name: '用水量',type:"bar",itemStyle:{color: new echarts.graphic.LinearGradient(0, 0, 0, 1,[{offset: 0, color: '#83bff6'},{offset: 0.5, color: '#188df0'},{offset: 1, color: '#188df0'}])}}]);
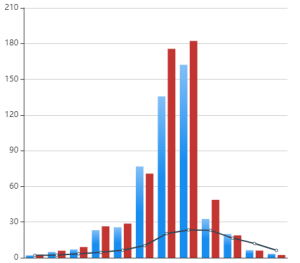
- 完整示例3--柱状图和折线图混合:
- pkchartbar.setSeriesData("bar1", [[2.0, 4.9, 7.0, 23.2, 25.6, 76.7, 135.6, 162.2, 32.6, 20.0, 6.4, 3.3],[2.6, 5.9, 9.0, 26.4, 28.7, 70.7, 175.6, 182.2, 48.7, 18.8, 6.0, 2.3],[2.0, 2.2, 3.3, 4.5, 6.3, 10.2, 20.3, 23.4, 23.0, 16.5, 12.0, 6.2]]);
- pkchartbar.setSeriesInfo("bar1",[{name: '蒸发量',type:"bar"},{name: '降水量',type:"bar"},{name: '平均温度',type:"line"}]);
专有事件
- onChange事件。当鼠标点击某个柱子时,触发onChange事件。参数:objectname,value。其中value包括:value,name等
...