基于echarts 的图表控件的柱状图部分。api参考网址:https://www.echartsjs.com/zh/index.html
包括折线、柱状图(竖直)、bar图(水平图)等形式。
工具位置
- 左侧图表控件
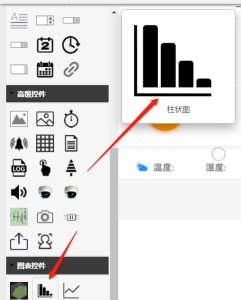
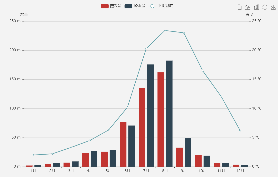
画面效果
方法
- js对象名称:pkchartbar
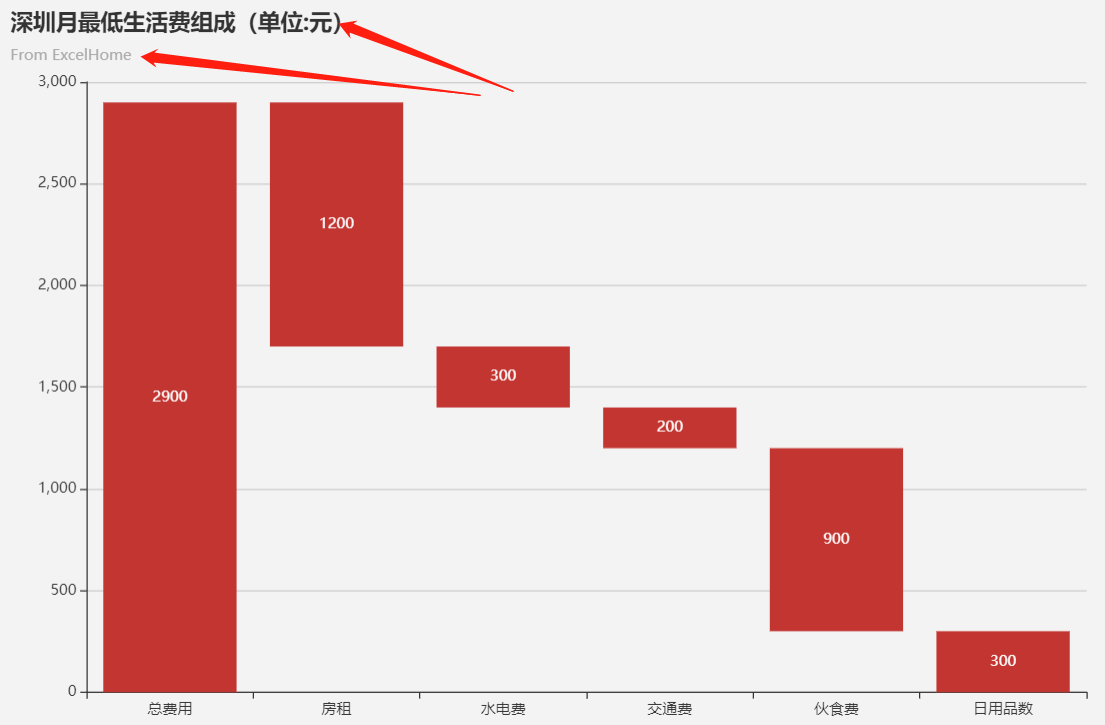
setTitle:function(objectname,title,subtitle)。设定图表的标题和子标题。无返回值。示例:pkchartbar.setTitle("charbar1","深圳月最低生活费组成(单位:元)","From ExcelHome");
- setTooltip:function(objectname,tooltip)
- setToolbox:function(objectname,feature)。示例:pkmobileswitch.setBgColor("switch1","green")
- setLegend:function(objectname,lengendNames)。示例:pkmobileswitch.setBgColor("switch1","green")
- setXAxisInfo:function(objectname,xAxisesInfo)。示例:pkmobileswitch.setBgColor("switch1","green")
- setXAxisData:function(objectname,xAxisesData)。示例:pkmobileswitch.setBgColor("switch1","green")
- setYAxisInfo:function(objectname,yAxisesInfo)
- setYAxisData:function(objectname,yAxisesData)
setToolbox:function(objectname,feature)。示例:pkmobileswitch.setBgColor("switch1","green") - setSeriesInfo:function(objectname,seriesInfo)
- setSeriesData:function(objectname,seriesData)
完整示例1:
完整示例2:
完整示例3:
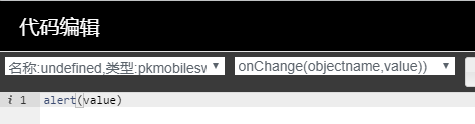
专有事件
- onChange事件。当鼠标点击某个柱子时,触发onChange事件。参数:objectname,value。其中value包括:value,name等
专有动画关联
- 无
专有属性配置对话框
- 暂无